
Has the housing market crash been canceled? That is the question many real estate and mortgage professionals are asking after a year of housing crash predictions have failed to materialize- at least nationwide
Continue reading
Has the housing market crash been canceled? That is the question many real estate and mortgage professionals are asking after a year of housing crash predictions have failed to materialize- at least nationwide
Continue reading


[FHA/HECMWORLD]
After a long delay the most recent FHA Single Family Production report was released earlier this month revealing November HECM application activity.
Other Stories:
[BankRate] Is the housing market going to crash in 2024? Here’s what the experts are saying.
[Motley Fool] No Soft Landing: Citi Bank’s chief economist sees an impending recession.


 HSom
HSom

This week we look at what reverse mortgage professionals may expect of home values in 2023
Continue reading
We shouldn’t be surprised at the state of today’s housing market. Not one bit. What we can do is glean a few valuable lessons along the way such as…
Continue reading
[Housing Wire] It will get worse for the housing market – and mortgage industry – before it gets better. That’s the takeaway from a group of economists at Fannie Mae who slashed their forecast for 2022 home sales this week
Continue reading
Senior home equity is at risk as the housing market begins the big shift…
Continue reading
The continued surge in housing prices has confounded economists, housing experts, and investors alike…
Continue reading

Unable to use the embedded player? Listen here.
Good news. Few economists, if any, believe that the housing market will crash. The bad news most experts believed the same in the months and years leading up to the 2008 housing market crash.
If You Get This Message About Your Mortgage, Contact Authorities, FBI Says
Another lender is offering a reverse mortgage for Generation X


![]()
Perhaps you’ve noticed that housing prices are blowing up despite an uncertain economy and what appears to be a building second wave of COVID-19 infections. At this point, most of us are ready to accept some good news. However, there are some indicators that we are approaching a housing crisis while certainly, we have solid market indicators of improvement. As one Polish poet put it, “the truth usually is in the middle. Most often without a tombstone. Let’s dive in.
First, we will see a spike in evictions- not because landlords are booting out non-paying tenants, but because those property owners cannot pay the mortgage to the bank when they are no longer receiving rent payments. While this does not directly impact senior homeowners it will contribute toward increasing housing inventory which has a direct impact on housing prices. Next, let’s look at the state of the market comparing Black Knight’s July and August Mortgage Monitor reports.
[read more]
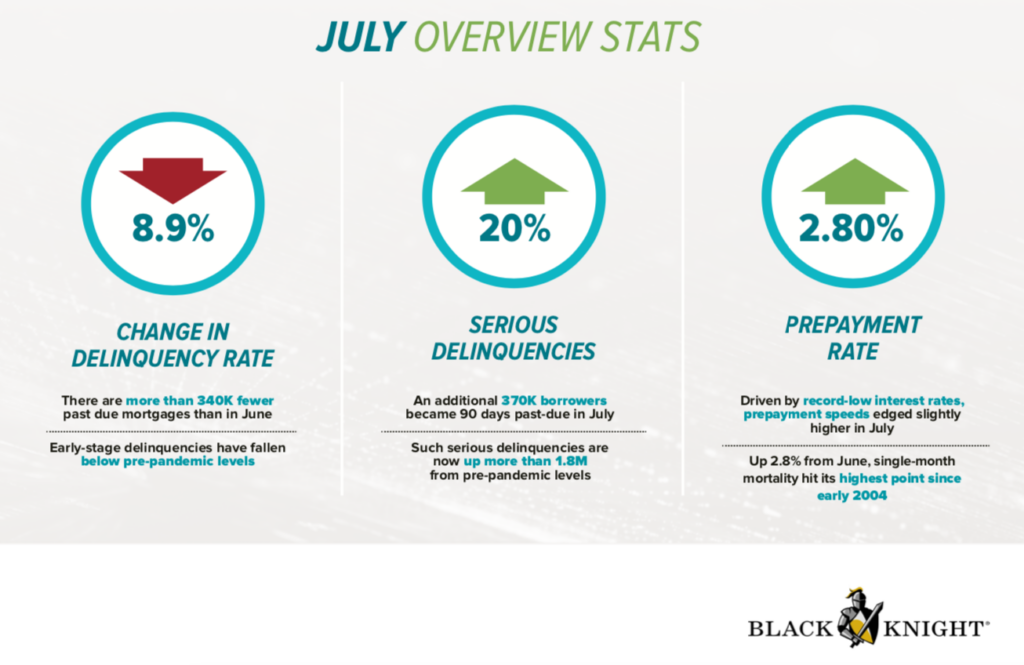
In its July report Black Knight’s stats who show serious mortgage delinquencies- that’s those who are 90 days past due or longer- jumped 20 percent in July for a total of 1.8 million more delinquencies before the pandemic. However, the overall delinquency rate fell by nearly 9%.
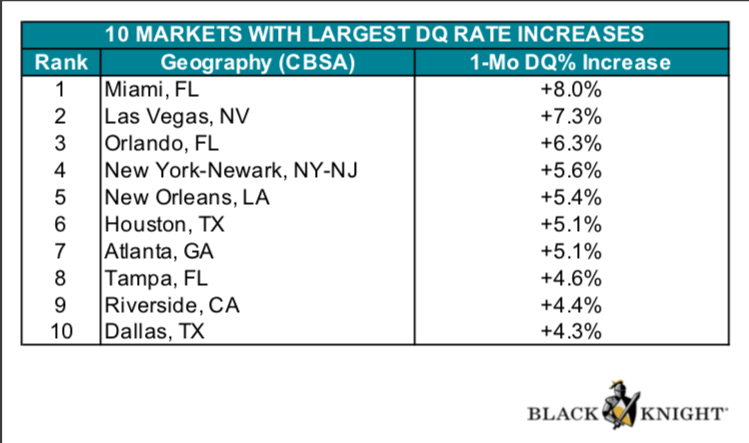
 Now, this is where our viewers serving some of our nation’s largest metros will want to pay attention. Here are the ten cities that had the largest increase in delinquencies in July. Florida holds three spots with Miami, Tampa, and Orlando. It’s not surprising to see New York and New Jersey on the list as two of the areas hardest-hit by COVID-19. Cities with the highest delinquencies will see more future foreclosures which naturally increases inventory and lowers prices. The markets with the largest delinquency increases are most likely those where state or local officials have enacted strict shut-down measures shuttering small businesses and spiking unemployment rates. However, keep in mind if we do see a reset in home values it historically has begun in larger metros and then trickles down to smaller communities.
Now on to some positive signs of improvement. The rate of serious delinquencies slowed from July’s 20 percent to only 5 percent growth in August. As the U.S. GDP jumped nearly 33% in the third quarter this year and unemployment rates continue to drop many hope that requests for forbearance plans continue to dwindle after their spike earlier this spring. Outside of historically-low interest rates, the continued lack of housing inventory is sustaining current housing prices. Mortgage delinquencies 100-113% higher than last year as millions found themselves unable to earn an income while sheltering in place, The good news is that many of these individuals are going back to work as evidenced by 41% of those were in a COVID-19 forbearance plan have resumed making their monthly payment.
While these are positive signs of a partial recovery uncertainty remains our biggest challenge. Black Knight Data & Analytics President Ben Graboske explained, “At the current rate of improvement, delinquencies would remain above pre-pandemic levels until March 2022. What’s more, when the first wave of COVID-19-related forbearance plans reach their 12-month expiration period, we would still have a million excess delinquencies.”
In conclusion, what we have is a mixed bag. What could be a looming housing crisis, positive economic indicators, millions resuming their mortgage payments, and of course a red-hot housing market? Our best approach is a stoic one- don’t overindulge in dire predictions, watch key market indicators closely, and consider adjusting your marketing efforts outside larger metros should housing trends turn sour in urban markets.
Resources mentioned in this episode:
BLACK KNIGHT’S JULY 2020 MORTGAGE MONITOR [READ]
BLACK KNIGHT’S AUGUST 2020 MORTGAGE MONITOR [READ]
[/read]