


The 10-year CMT breaks 4.5%
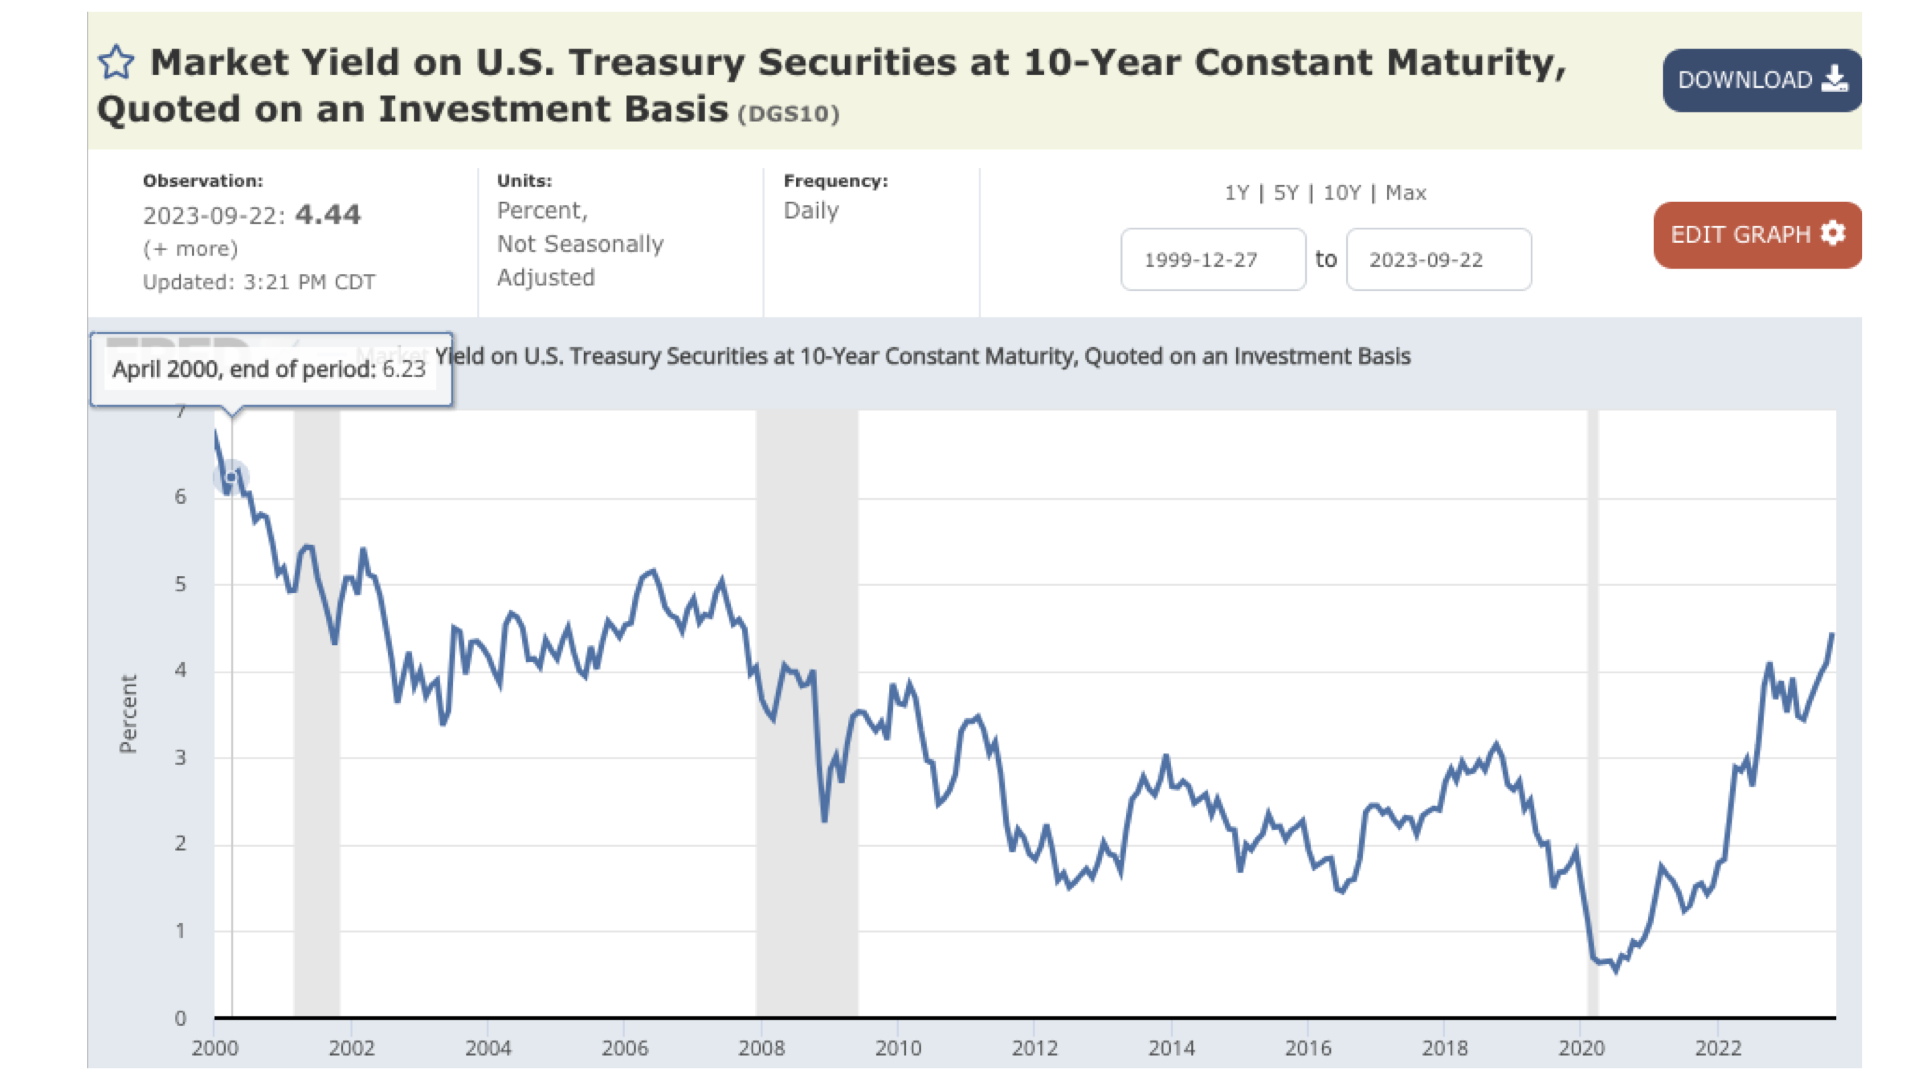
The 10-year Constant Maturity Treasury Rate (CMT) has surged to 4.5%, marking a significant 27% increase over the past five months. This keystone index plays a crucial role in determining the expected interest rate of a Home Equity Conversion Mortgage (HECM). It’s essential to examine its trajectory over the last two decades to gain perspective.
In April 2000, the 10-year CMT stood at a robust 6.23%, only to gradually decline, reaching a low of 0.55% in July 2020. Even earlier, in April 1989 when the first HECM loan was issued, the rate was a staggering 9.02%.
Factors such as inflation, interest rate risks, and investor confidence shape the 10-year CMT. These components reflect broader economic conditions and influence treasury yields, as explained by Investopedia.
Inflation and the 10-Year CMT
Despite the Federal Reserve’s vigorous pace of interest rate hikes, inflation has proven to be a persistent challenge for both the central bank and consumers. In August, the headline Consumer Price Index (CPI) recorded a significant 0.63% jump from July, the largest increase since June 2022 when it peaked at 9.1%. This surge is predominantly attributed to the escalating fuel costs. Following the collapse of crude oil futures at the onset of the COVID-19 pandemic, oil prices rebounded from a low of $22 a barrel in March 2020 to a peak of $118 a barrel in June 2022, now stabilizing around $90.
Crude oil futures wield considerable influence over gasoline prices, impacting not only the headline CPI but also the Core CPI. The costs of shipping, aviation, and transportation are all intertwined with the average price per gallon of gas.
The Curse of Money Printing
The substantial increase in inflation and the 10-year CMT may be further exacerbated by extensive money printing. Shockingly, as of the close of 2021, a staggering 80% of all U.S. dollars in circulation were printed since January 2020. At the start of 2020, $4 trillion of U.S. currency was in circulation, skyrocketing to $6.7 trillion by January 2021 and hitting an astonishing $20 trillion by October 2021. This phenomenon is aptly summarized by economists as “too many dollars chasing too few goods.”
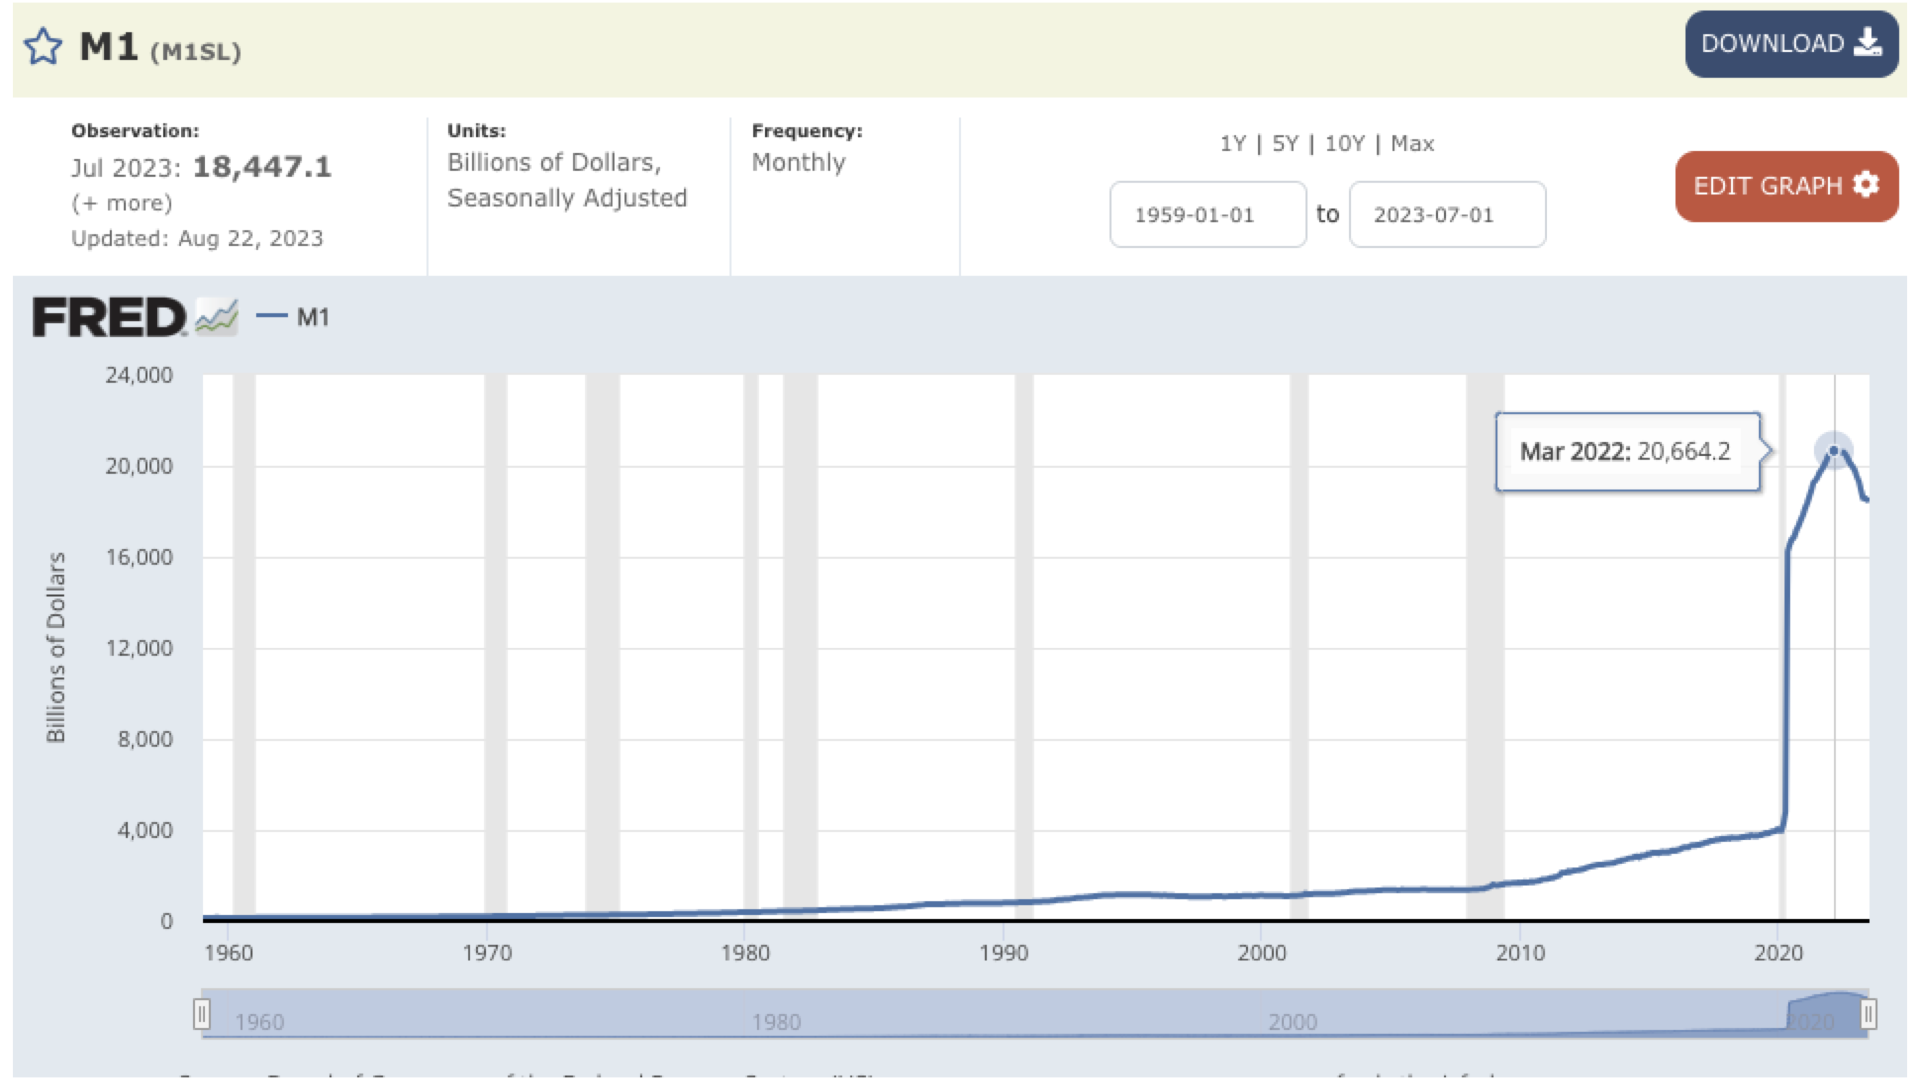
While the Fed has initiated measures to tighten the money supply, its impact on inflation lags behind by several months. The chart depicting the M1 money supply vividly illustrates the Fed’s unprecedented money printing endeavors, followed by subsequent efforts to tighten monetary policy.
Forecasts for the 10-year CMT vary widely, with some anticipating a significant drop by the close of 2024, while others predict the index could reach 5.365% by the end of 2023. Both scenarios may materialize contingent on the Fed’s decisions regarding interest rates.
In conclusion, although the 10-year CMT has witnessed a substantial rise, it still falls well below the higher benchmarks established over the last two decades. A potential shift in Fed policy towards lowering rates, and subsequently a lower CMT, could potentially unlock the housing market logjam, leading to a surge in inventory. Until then, we remain in a state of anticipation and observation.


1 Comment
There are several significant differences between today’s HECM and the first HECM endorsed in fiscal 1990 including 1) significantly higher PLFs in fiscal 1990, 2) no LESAs in fiscal 1990, 3) no inclusion of younger non-borrowing spouses than the borrower in determining PLFs back in fiscal 1990, 4) no limitation on how much of the PL can be taken in the first year in fiscal 1990, 5) a much lower MCA limit in fiscal 1990, 6) a much lower margin used in determining both the expected and note interest rates back in fiscal 1990, and 7) back in fiscal 1990, Fannie Mae, not Ginnie Mae investors, purchased all HECMs originated.
So have all of the consumer protections made HECMs a more saleable product today than before October 1, 2010? Politically the only correct answer is to say that those consumer protections have made HECMs better reverse mortgages for consumers. BUT is that really so?? Some will say “NO!!!”